Assessing High-Noise Areas
Industrial hygienists are challenged to protect employees from noise exposure in all types of work environments, including variable conditions. This project completed a baseline noise assessment at the Dow Northeast Technology Center’s mechanical areas.
Noise is a ubiquitous hazard present in workplaces that can be difficult to characterize in variable work environments. Work-induced hearing loss, one of the most prevalent occupational illnesses, is a result of repetitive high noise exposure. In addition to hearing loss, workers who are overexposed to noise are at risk for developing hypertension.
OSHA indicates that a personal exposure level exceeding 85 dBA requires enrollment of the exposed worker in a hearing conservation program. Companies have the responsibility to assess noise levels and determine whether adequate protections exist to maintain workers' health. Industrial hygienists are challenged to protect employees from noise exposure in all types of work environments, including variable conditions and newly commissioned facilities. In work environments that cannot be remediated to reduce levels below the OSHA action level, personal protective equipment (PPE) is required to protect employees.
Research was completed at the new Dow Northeast Technology Center in Collegeville, Pa. (shown in the photo accompanying this article), by utilizing an in-house noise mapping tool. This study completed a baseline sound level assessment within the mechanical areas to assist in the identification of sources and areas needing exposure controls. This study addressed potentially at-risk workers, including all Dow Chemical employees and contractors who work in the mechanical areas at the Collegeville location. These workers include mechanics, electricians, carpenters, plumbers, ironworkers, laborers, engineers, and inspectors. Dow Chemical, like many other companies, defers to ACGIH’s eight-hour TWA of 85 dBA with a 3 dBA doubling factor, because current occupational data show these values are more protective. Exposure control implementation was completed in all work areas exceeding 85 dBA.
The Dow Physical Agent Mapping Tool was used to elucidate spatial patterns. This software produces visual aids to depict sound levels within the mapped area. Area noise surveys were completed in a grid pattern, and the data were entered into the mapping tool. Excessive noise areas were defined by noise levels > 85 dBA. The Casella USA Model CEL-62X sound level meter was used to measure the noise levels. The CEL-62X was calibrated before and after each sampling period to 114dBA using the Casella USA CEL-284/2 acoustical calibrator; the instrument remained within the respective calibration range throughout the sampling period.
A total of seven mechanical areas were assessed for this study. The sampling period was completed once per month over a four-month period. This data collection strategy resulted in 28 area noise maps. For each of the sampling events, outdoor temperature and humidity conditions were recorded to assist with noise source interpretation. Building diagrams of mechanical areas were provided by Dow Chemical and reformatted with a grid. The gridded diagrams were utilized by the surveyor for efficient data collection and notation.
In areas that have air handling equipment such as exhaust fans or other pieces of equipment related to temperature regulation, equipment operation was noted during data collection. Sound level measurements were inputted into the Physical Agent Mapping Tool, which created color-coded maps of noise levels within the mechanical areas for each sampling date. To further characterize the data, spatial and temporal comparisons were made using the Kruskal-Wallis test. This nonparametric test was used since a Chi Square test indicated the dataset was not normally distributed.
Baseline Noise Survey Results and Discussion
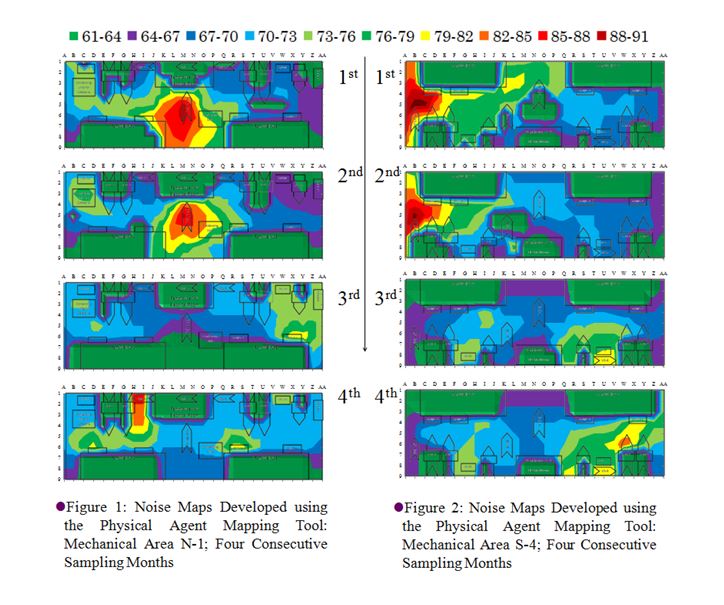
A visual assessment of the monthly noise maps for each area indicated variation in sound levels over this four-month period. Examples of these maps are shown in Figures 1 and 2, which display the temporal change in noise levels over the four-month sampling endeavor.

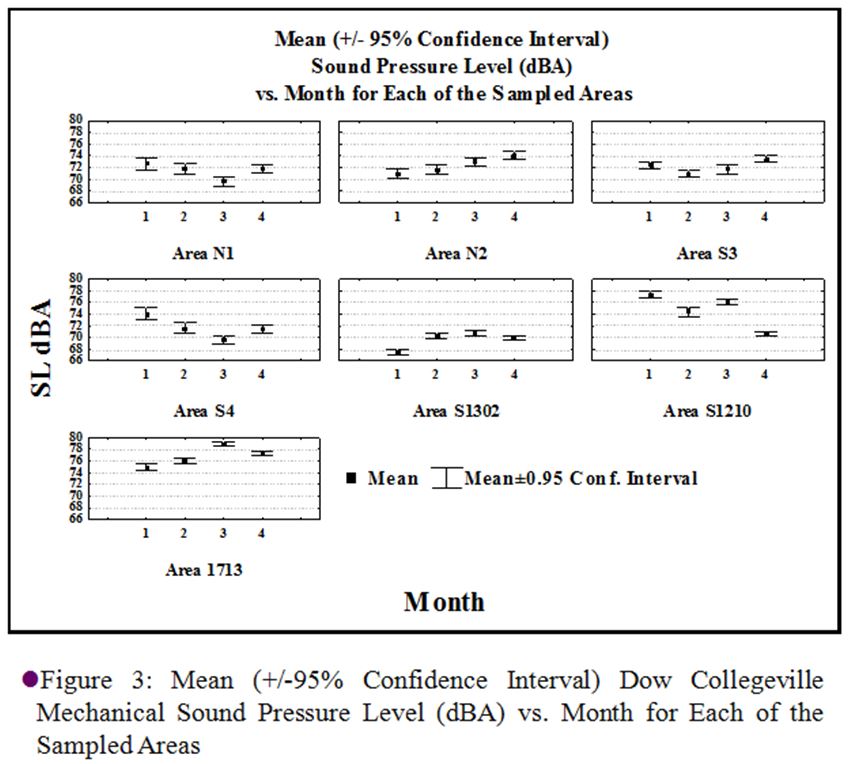
The exposure reduction actions taken within the mechanical areas include implementation of warning signage about hearing protection requirements, area demarcation with appropriate signage, and the provision of the necessary PPE. Using the maps as visual aids, the areas with noise levels exceeding 85 dBA were clear so they could be demarcated with the appropriate signage, and PPE was provided to employees working in those areas. The temporal change for each mechanical room is shown in Figure 3.

Statistical analysis (Kruskal-Wallace ANOVA, α = 0.05) indicates that there was a significant difference among mechanical rooms (p<0.001). Using the Kruskal-Wallace ANOVA (α = 0.05) for temporal data showed significance (p=0.0012) with the multiple comparisons test, indicating that month 2 was significantly different compared to months 3 and 4. The differences among mechanical rooms can be attributed to the diverse equipment within each mechanical area. Some mechanical areas were limited to temperature regulation equipment, while others were more diverse, including exhaust fans, water purification systems, or compressors.
Because these various noise sources do not operate constantly, ensuring that each noise sources has been characterized is of utmost important for industrial hygienists. The temporal differences were due to the need for heating or cooling, depending on the season. Variability in weather conditions alters the equipment operation in order to achieve desirable indoor conditions. Noise sources that were present in the colder months included steam leaks, which can be unpredictable at times. Routine monitoring throughout all areas and equipment conditions can ensure proper noise hazard identification.
Conclusions and Recommendations
This project completed a baseline noise assessment at the Dow Northeast Technology Center's mechanical areas in order to protect employees from excessive noise exposure. This research classified a high-noise area as one exceeding an area sound level of greater than 85dBA. The Physical Agent Mapping Tool created maps to succinctly depict the high-noise areas. A total of seven mechanical areas were assessed over four sampling periods, resulting in 28 area noise maps.
Due to the temporal and spatial differences noted in this study, it is recommended that industrial hygienists complete multiple area noise assessments in mechanical areas, because one area noise assessment is not representative of all possible noise sources. Furthermore, additional consideration for noise hazards should be given to newly commissioned facilities or areas affected by seasonal weather variation. Additional research regarding the variation in sound levels within mechanical areas due to equipment usage related to weather conditions will be completed at this site and considered for other industrial sites.
Noise mapping proved to be an efficient sampling approach when completing noise surveys in large indoor areas. The surveyor carried the gridded maps during the survey and worked in a linear pattern to collect the data. In addition, carrying the same map resulted in a consistent sampling strategy. The maps were a helpful visual aid to explain the process of exposure control actions to management and employees. The maps clarified the areas needing demarcation around specific noise sources such as compressors, steam leaks, or exhaust fans, and repetitive mapping pinpointed different sources of concern at different times. The visual aids created by this tool can be used for training sessions to educate employees about the hazards of noise exposure and the need for PPE in defined locations. The maps can also be used as signage at each mechanical area entrance to indicate areas of high noise.
Issues that should be considered when contemplating the use of noise mapping were documented in this study. These factors include accessibility of up-to-date maps, area size, amount of equipment, and ventilation within the area. Anticipation of the number of noise sources will help to determine the level of detail needed when gridding the map in a mapping tool. All of these factors influence the effectiveness and efficiency of the mapping process.
This article originally appeared in the May 2016 issue of Occupational Health & Safety.